

Jean Thie - Ecoinformatics International
The present abundance of high-resolution satellite imagery in remote parts of the world opens up new dimensions in studying and monitoring amazing landscapes with Google Earth. This is also the case with Tierra del Fuego, the fascinating and remote southern tip of South America. An amazing area because of its location, mountains and wetlands and …..its exploding beaver presence. For a remote area, an unusual amount of high resolution images are available through Google Earth and Apple maps.
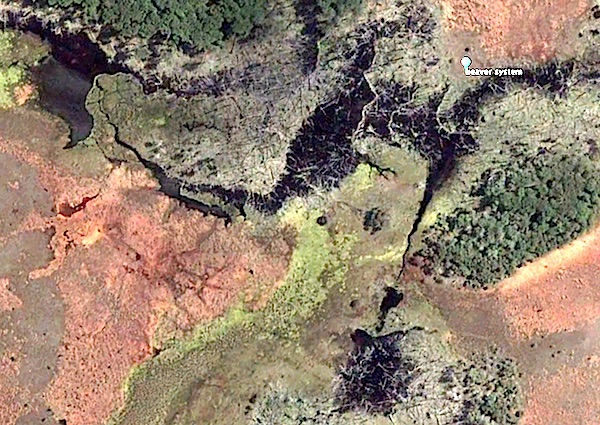
Figure 1: Example of beaver activity in small streams and wetlands as seen with high resolution Google Earth imagery, source CNES Astrium, dated February 3, 2015

In 1945-1946, Tom Lamb of Lamb Air was asked to provide and deliver 50 Manitoba beavers to the small community of Ushuaia in Argentine. He collected the beavers in Northern Manitoba and released them near Fagnano Lake at the mouth of the Claro River. The goal of the introduction was to promote a fur industry. The beaver population has grown and expanded exponentially and geographically: present estimates more than 100’000!
This expansion has been described and mapped by C.B. Anderson, 2006. The Abstract of Anderson's paper provides a succinct overview of the status of the beaver in this area.(It should be noted that the present consensus is that 20 pairs of Canadian Beaver were released and not 25):
1. Twenty-five pairs of North American beavers Castor canadensis Kuhl were introduced to Tierra del Fuego Island in 1946. The population has expanded across the archipelago, arriving at the Chilean mainland by the mid-1990s. Densities range principally between 0.5–2.05 colonies/km. They have an impact on between 30–50% of stream length and occupy 2–15% of landscape area with impoundments and meadows. Beaver impacts constitute the largest landscape-level alteration in subantarctic forests since the last ice age.
2. The colonization pattern, colony densities and impacted area indicate that habitat in the austral archipelago is optimal for beaver invasion, due to low predator pressure and suitable food resources. Nothofagus pumilio forests are particularly appropriate habitat, but a more recent invasion is occurring in adjacent steppe ecosystems. Nonetheless, Nothofagus reproductive strategies are not well adapted to sustain high beaver population levels.
3. Our assessment shows that at the patch-scale in stream and riparian ecosystems, the direction and magnitude of exotic beaver impacts are predictable from expectations derived from North American studies, relating ecosystem engineering with underlying ecological mechanisms such as the relationships of habitat heterogeneity and productivity on species richness and ecosystem function.
4. Based on data from the species’ native and exotic range, our ability to predict the effects of beavers is based on: (i) understanding the ecological relationships of its engineering effects on habitat, trophic dynamics and disturbance regimes, and (ii) having an adequate comprehension of the landscape context and natural history of the ecosystem being engineered.
5. We conclude that beaver eradication strategies and subsequent ecosystem restoration efforts, currently being considered in southern Chile and Argentina, should focus on the ecology of native ecosystems rather than the biology of this invasive species per se. Furthermore, given the nature of the subantarctic landscape, streams will probably respond to restoration efforts more quickly than riparian ecosystems.
Figure 2: expansion of beaver according to C.B. Anderson, 2006
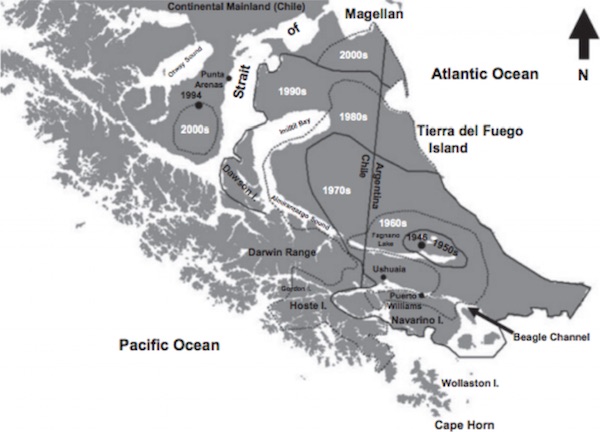
Using the Anderson map above, we explored beaver dams and habitat and mapped locations by expansion area starting with the first release in 1946 and ending with the most recent available images from 2016. The orange arrow shows the location of the first release. The various colours of the markers show the 'decades' of expansion. For example, the purple markers represent beaver dams in the 1945-1950 period; red markers the 1950-1960 period; the white markers shows dams that were build after 2000.
Figure 3: mapping and location of beaver activity on Google Earth according to expansion decades.
In 1945-1946, Tom Lamb of Lamb Air was asked to provide and deliver 50 Manitoba beavers to the small community of Ushuaia in Argentine. He collected the beavers in Northern Manitoba and released them near Fagnano Lake at the mouth of the Claro River. The goal of the introduction was to promote a fur industry. The beaver population has grown and expanded exponentially and geographically: present estimates more than 100’000!
Figure 3: Release of 20 pair of beaver at the mouth of the Claro River, 1946
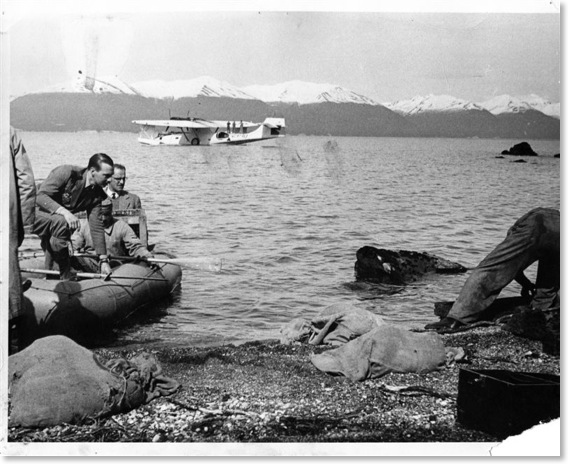
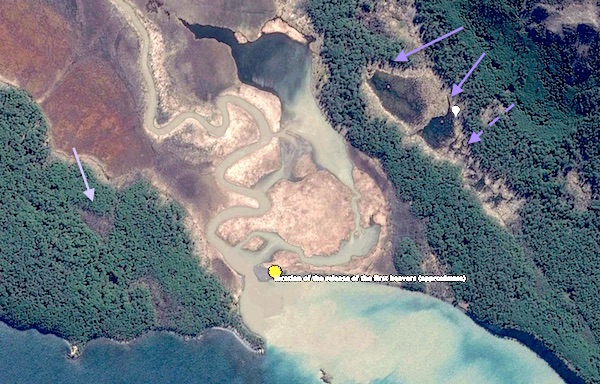
Figure 4: The release area in 2013. Beaver dams and lodges are visible near the purple arrows; the pink arrow shows recent tree kill; the yellow marker is the probable site of the release. Image date is 10-27-2013.

The purple markers show beaver systems in areas invaded between 1945-1950. The red markers show the expansion between 1950-1960.
Some examples of the impressive beaver dams, and landscapes are given below and many more in the attached KMZ file
The image below shows the series of beaver dams on both sides of the wetland close to the riparian forest where food is most abundant. The wetlands in the centre are bogs with abundance of sphagnum mosses.
Typical example of a stream managed by beaver in a densely forested area. Water flow in the stream is to the right. Date of the image is 20 November 2013. This stream was invaded by beaver before 1960 according to Anderson.

The white rectangle in the 2013 image above is enlarged in the most recent satellite photo available for this area: 23 October 2016. It give a good example level of detail which can be observed on this high resolution CNES Atrium image: killed trees, possible lodges.

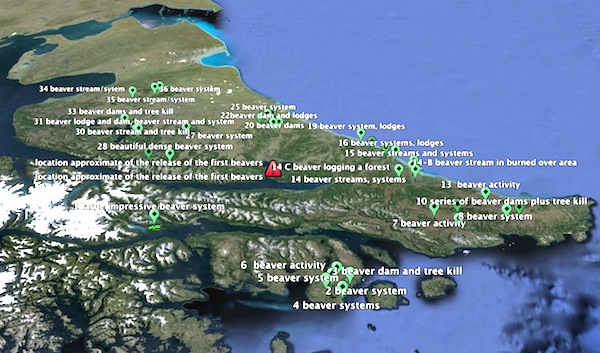
The attached KMZ provides 35 plus place marks giving a representative overview of the expansion area between 1960 and 1970. It is actually quite amazing to see the distances the beavers migrated in this short period of time. The selection of place marks is based the availability of high resolution GE and Apple images and the classification of the time line is based the map provided by C.B. Anderson shown earlier.
Some examples of the beaver systems in this selection:
A beautiful example of a high density beaver area associated with the impressive wetlands of Tierra del Fuego.
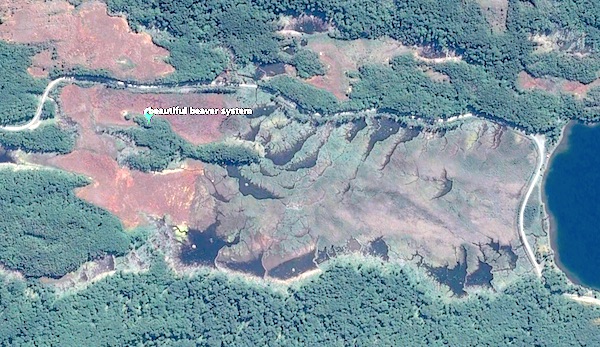
The image below shows a series of beaver dams in an areas that was burned over not too long ago. You can see the dead trees on the high resolution images in the grey areas. Not beaver kill in this case. Wildland fires have occurred frequently in the more northern areas of this distribution.

The image below is in a similar landscape as the beaver system above, but not burned by a wild fire. Trees killed by beaver can clearly be seen.
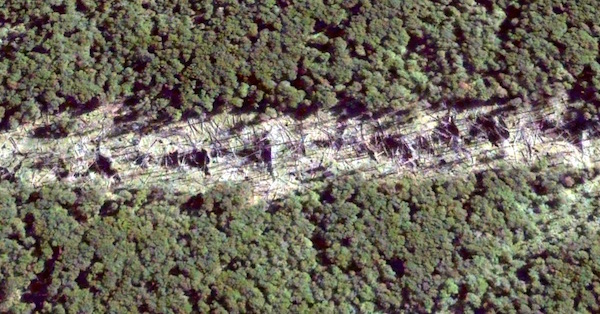
This mountain slope is being logged by beaver, using beaver streams to access their 'logging areas'.

Tierra del Fuego beaver expansion 1970-2000
The attached KMZ provides 15 plus place marks giving a sample overview of the expansion of the types of dams and beaver habitat. These more recent invasion areas do not show the dominance and impact we have seen in the areas colonized in the first 20 years. In fact the beaver dams and activity areas originating in the last decades are far more difficult to find.
It is quite amazing to see the distances they migrated in this short period of time. As before time line classification of place marks by decade is based on the map provided by C.B. Anderson.
The original location of the release in 1945 in red, the expansion areas in light blue, yellow and white.

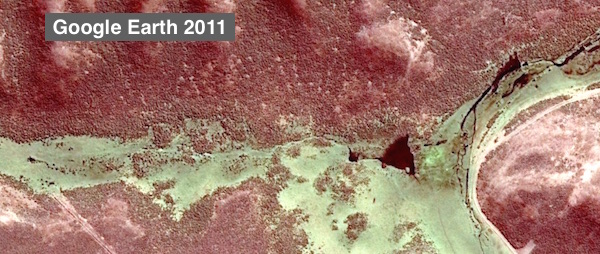
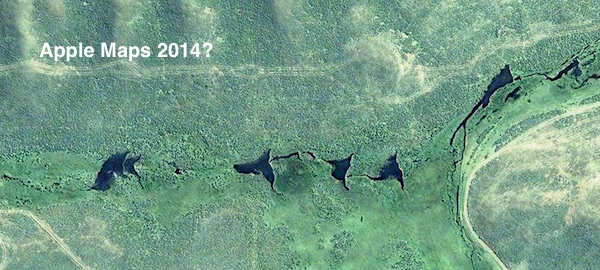
below an image of the most northerly beaver site I found on an GE image dated 2011. The Apple Maps image of a later date (2014 or 2015) shows a significant increase in dams in such a short period of time.
Tierra del Fuego beaver expansion after 2000
It is always exiting as some new high resolution imagery comes on-line in Google Earth. In this case it is around Magellan Strait were I did earlier some explorations of beaver habitat.
much of this imagery is from 2016. With this high resolution source (CNES/Astrium) dated 11-25-2016 it provides exceptional coverage for this area so frequently covered by clouds. The interesting part is that the beavers have crossed the Magellan Strait, swimming, I presume.
Expansion after 2000 KMZ
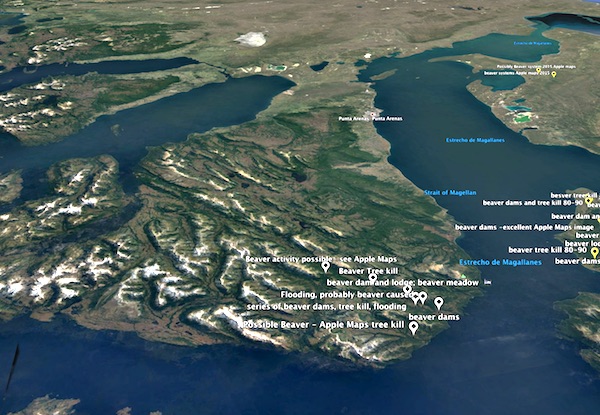
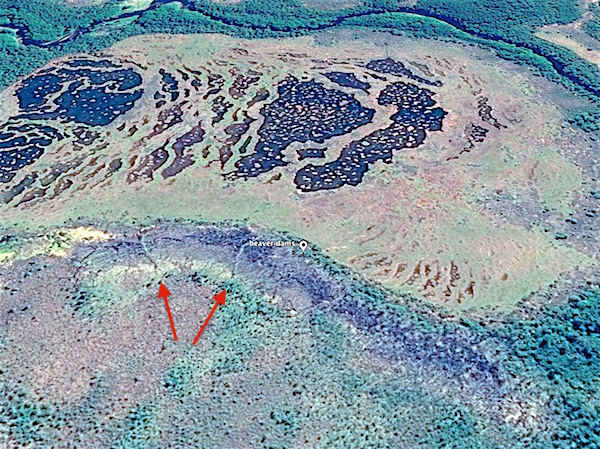
Also Apple maps provide good additional high resolution coverage as the example below shows. The red arrow point to an area with some beaver dams, flooding and vegetation kill.

The same area on Google Earth ; red arrows point to beaver dams.
The expansion of beavers in Tierra del Fuego remains an amazing story.... the 20 pairs that created a population of over 100'000. Where did they come from?, what ecosystems formed their original natural habitat?

The GE image below gives an overview of the Saskatchewan River Delta with the locations of Devils Portage, Caroline Lake and Moose lake where the Lamb family had a trading post. (We visited the Trading Post in 1967 when we were doing field work for the Canada Land Inventory Project)
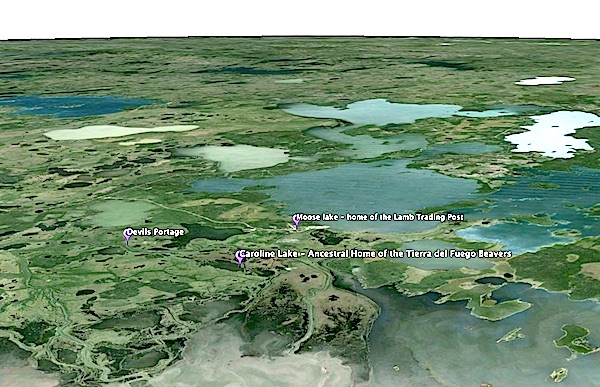
The white arrow points at a beaver lodge at the edge of Caroline Lake

The publication (PDF) INVASIVE NORTH AMERICAN BEAVER (Castor canadensis): THE DISTRIBUTIONOF MITOCHONDRIAL VARIATION ACROSS THE ARCHIPELAGO OF TIERRA DEL FUEGO by Mariana Fasanella et al.
The three areas they study reflect the beaver area colonized in the first decade (1) the Fagnano Lake Area, where they were released in 1946. Areas (2) is Tierra del Fuego National Park colonized about two decades later. Area (3) Isla Dawson was colonized again two decades later.
The researchers identified seven unique D-loop haplotypes for the three areas. They are 'mapped' below.
As follow up to the genetic origin study of the Tierra del Fuego (TDF) beaver population in the previous post, I found another source with more specific review about the introduction of North American Beaver in Tierra Del Fuego.
Alejandro G. Pietrek and Laura Fasola in their paper on 'Origin and history of the beaver introduction in South America' provide some interesting information. (Mastozool. neotrop. vol.21 no.2 Mendoza dic. 2014)
The authors found that: "contrary to what has been widely assumed, only 20 beavers were released in a single introduction event in 1946". In this regard Lamb wrote in his letter "We only had three or four days of trapping when we got an inch of ice... I would watch beavers walk over our trap... however, we got 20 beaver when we would hardly get back to The Pas late October."
The authors also speculate that the beaver population in northern Manitoba (i.e. the founders of the TDF population) probably had a mixed origin. An article published on April 9, 1936 in the Winnipeg Free Press and entitled "Six beaver taken north in restocking venture," states that "forward looking plans for the restocking with beaver on a large expanse of fur bearing territory around Moose Lake, will be advanced with the departure by air plane from Stevenson Field of six beaver from New York State." The airplane pilot was again Tom Lamb. In the 1930s and 1940s beavers had nearly disappeared from northern Manitoba due to over trapping. In addition to this, beaver were live trapped in other areas south of Manitoba and translocated north by truck and aircraft (Manitoba, the keystone province 1948; Malaher, 1984). These measures proved to be successful, and beaver catches rose from 6361 pelts in 1939-1940 to 51 318 beavers in 1963-64 (Smith, 1976). Although we did not find further documentation on restocking in Moose Lake, this was probably one of many translocation targets in northern Manitoba.
References
Beaverdams Mapped on Google Earth