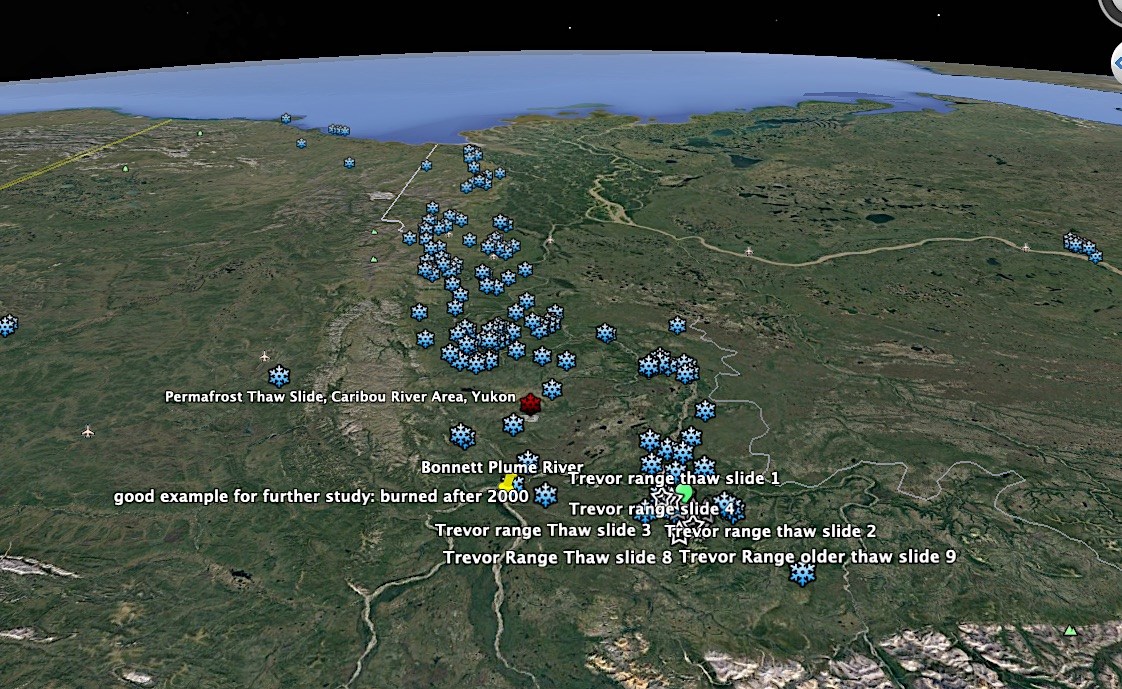
An excellent selection of sites in the Yukon showing significant slides and regression of permafrost in mineral soils was made available on Google Earth by "kingpointnorth" (Google Earth BBS link no longer available, but this link is to my record of his locations) in 2005. Some of the sites he found had then and have now a good high resolution satellite image coverage. An example is the slide near the Bonnet Plume River which I describe below in more detail. (image overlays on Google Earth)

In the context of climate warming, it is interesting to look at some of these sites over a period of 50 years or more. Aerial photography has been taken in the North since the mid 1920's. From the 1950's on aerial photography becomes a more dependable source of information for comparison. (See the National Air Photo Library on-line site).
I have taken a few if the sites and analyzed the information below from a time series perspective.
This site is within the Peel River Plateau Ecoregion and the Taiga Plain Ecozone. The landscape is almost entirely shaped as result of the Laurentide glaciation, and post glacial fluvial and other geomorphological processes. Continuous permafrost is present with depth to base of ice-bearing permafrost close to 300m (Geological Survey of Canada, unpublished data). Retrogressive thaw flow slides are common where ground ice has been exposed in glaciolacustrine deposits by forest fires, debris flows and regressive erosion. (Ecoregions of the Yukon: Peel River Plateau).
 |
Figure 1: This Google Earth oblique image shows a permafrost slide near the Bonnet Plume River. The slide is significant in size. The active melting edge is about 2700 meters in length. The maximum regression distance is 1250 meters. The slide shows continuing erosion and melting and as the air photo sequence below indicates started well before 1949. The high resolution GE image shows a recent forest fire (dark grey green) on top of the plateau. The steeper escarpment facing this way, was not burned except around |
 |
Figure 2: 1949 air photo shows that a significant slide occurred before 1949 (outlined in blue). The dotted lines identify other active slide areas. It would suggest that significant sliding started between 1935 and 1945. Wildland fire history records are available for this areas since 1946. According to these records,the first major fire occurred between 2000-2004. Considering the large amount of sliding before 1949, one can speculate the a significant fire occurred during that period possible associated with an above average warm summer. |
 |
Figure 3: 1953 Air Photo The slide areas appears to have stabilized in this image. The major slide area (right) is still active, but the small ones are covered by sparse vegetation
|
 |
Figure 4: 1968 Air Photo The major slide area in 1968. The red line outlines the slide, the dotted lines show some smaller active slide areas on the escarpment which have stabilized by 1994 and show no further sliding. Between 1949 and 1968 the melting rate showed a maximum of 12.7 meters per year and a median rate of 7.8 m/y. The smallest regression rate in this period was about 4.5 m/y |
 |
Figure 5 1994 Air Photo The yellow dotted line shows the melting edge in 2007. Between 1994 and 2007 the melting- permafrost regression rate varies from a maximum of 17.5 meters per year to an average of about 10 m/py to a minimum of less than 1 m/py. Melting rates between 1963 and 1994 are as follows: Maximum rate was 8 m/y: median 4.4 m/y and minimum 2.4m/y.
|
 |
Figure 6: 2007 Google Earth image with permafrost melting stages between 1949 and 2007. The maximum rate of melting over this 58 year period averaged out to 9.2 meters per year. The lowest rate to about 5.1 m/y. The median about 6.8 m/y. The melting rate measured was the fastest during the last 14 years (maximum rate 17.5 my; median 11.5 m/y; minimum 4.2 m/y). The thin light dotted line separates the area burned between 2000-and 2004 (see fire history map below) |
 |
Figure 6 NASA 1990 Landsat Pseudo Colour image. This 1990 image provides some indication of the fire history. The white square represents approximately the area covered by the air photos above. The slide itself shows as purple, devoid of vegetation and moist. |
 |
Figure 7. 2000 Landsat image shows that the slide has increased, but also that the vegetation cover types are essentially the same in 1990 and 2000: no forest fires have occurred. |
 |
Figure 8 Fire History: The study area was burned between 2000 and 2004 according to the map to the left. |
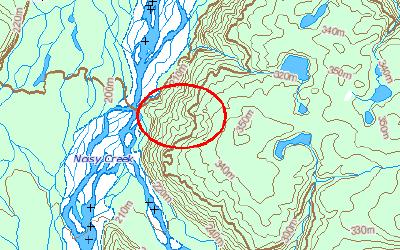 |
Figure 9: Topographic Map Detail for the permafrost slide area highlighted by the red oval. |
 |
Figure 9: Segment of the Canada Geological Survey Map of Canada: number 1880A- Surficial Materials of Canada This map was compiled by my former colleague and friend R.J. Fulton, 1995
|